In the context of Designing and Implementing Enterprise Network Assurance (300-445 ENNA) , capacity planning requires accurate baselining of interface bandwidth against its theoretical and provisioned limits. Analyzing Exhibit 4.5 Question 4 (image_79d4fc.jpg) reveals a significant discrepancy between the physical reality of the link and its configuration within the monitoring tool.
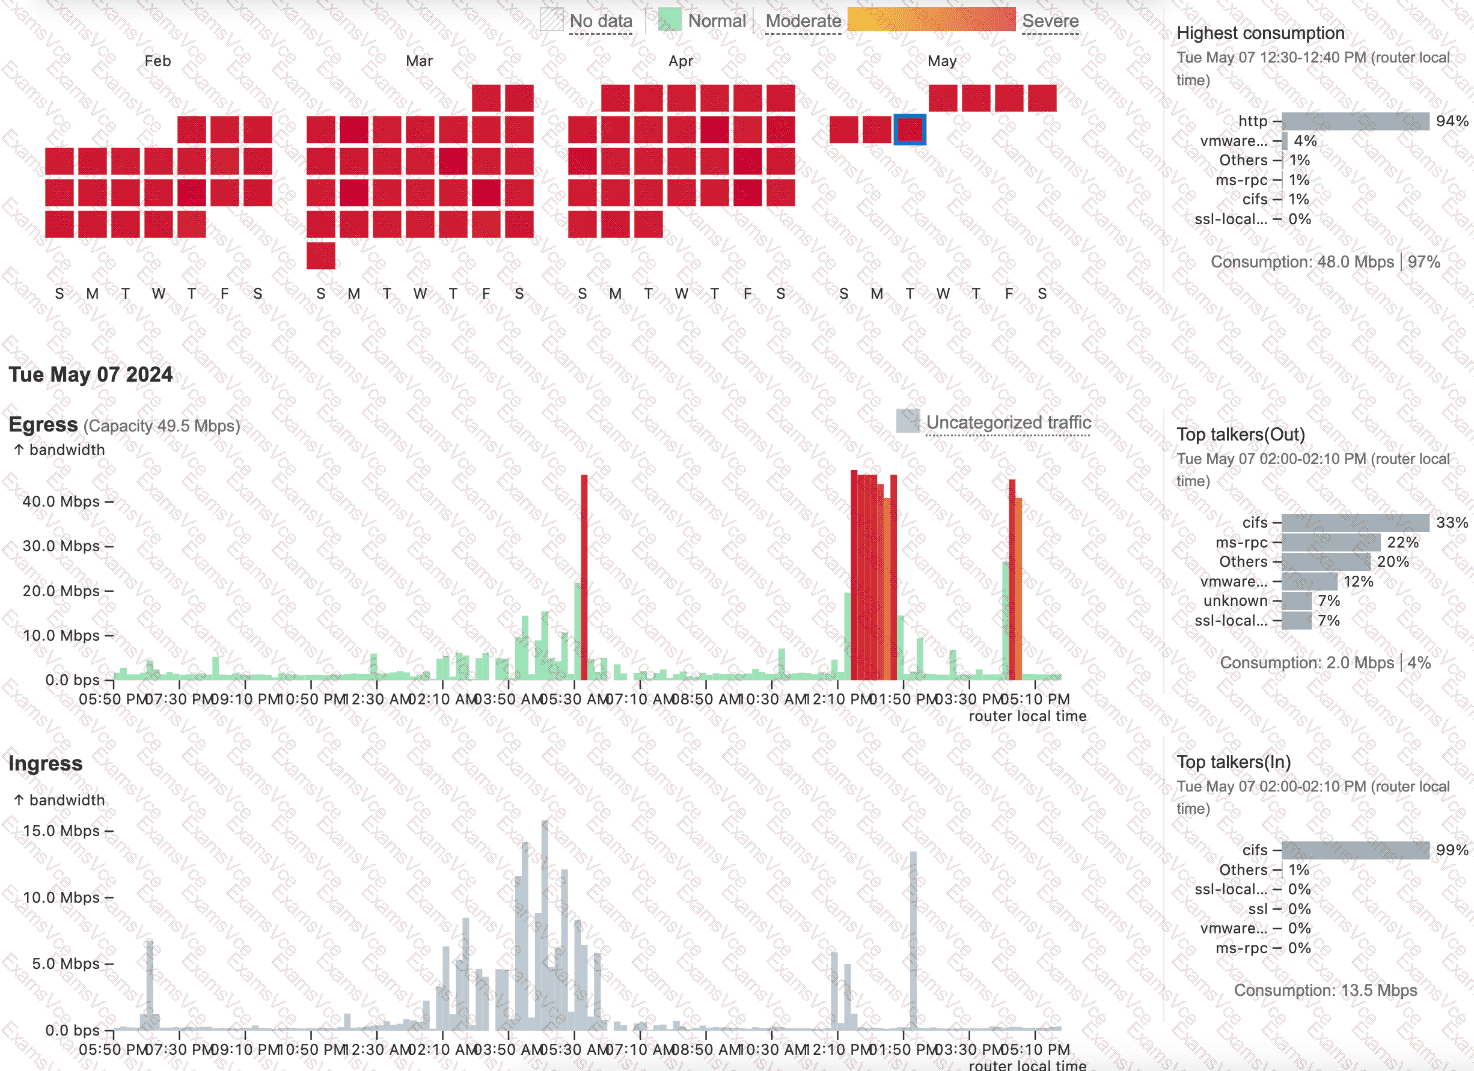
The exhibit displays a capacity planning dashboard with a calendar heatmap and traffic graphs. The heatmap for February through May shows a high frequency of " Severe " (red) utilization blocks. Looking at the Egress graph for Tue May 07 2024 , the traffic spikes clearly exceed 40.0 Mbps. Crucially, the dashboard indicates an " Egress Capacity " of 49.5 Mbps and reports that the " Highest consumption " was 48.0 Mbps, representing 97% of the available bandwidth.
However, the question states that the ISP provides a 1 Gbps (1000 Mbps) connection . Since the actual traffic being sent is less than 50 Mbps, the link is nowhere near physical saturation. The " Severe " alerts and high utilization percentages are occurring only because the monitoring software (likely ThousandEyes or a similar NMS) is configured with a Maximum Capacity of only 49.5 Mbps for this interface. This misconfiguration causes the tool to calculate utilization based on a much smaller " pipe " than what actually exists, leading to false-positive alerts.
Therefore, the most likely action to fix this observed behavior is to reconfigure maximum capacity for the interface (Option B) to match the 1 Gbps specification.
Option A is unnecessary because the current link is only being utilized at ~5% of its 1 Gbps potential.
Option C is a restrictive policy change that is not justified given the actual available headroom.
Option D might shift how data is displayed but will not fix the underlying mathematical error in utilization calculations.