New Year Sale Special Limited Time 70% Discount Offer - Ends in 0d 00h 00m 00s - Coupon code: xmasmnth

Refer to the exhibit.

Refer to the exhibit.

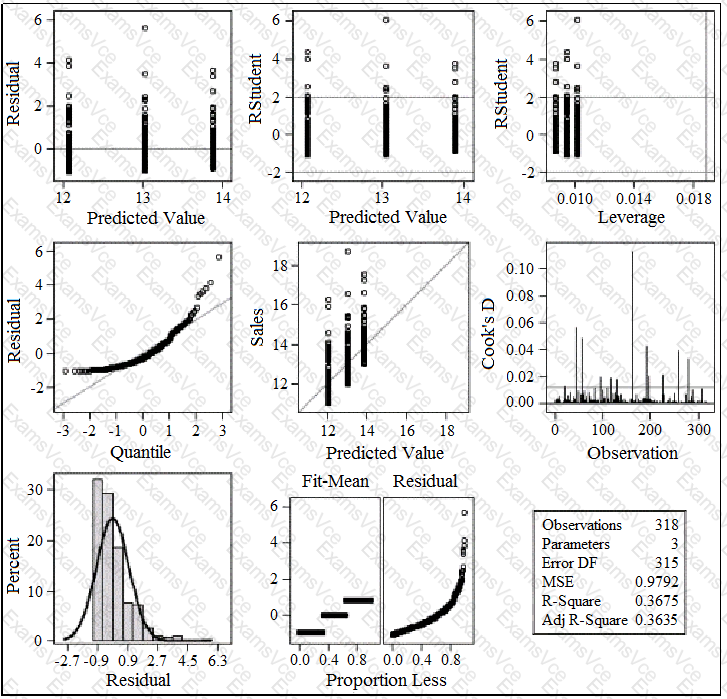
These graphs were created using the GLM procedure with the plots(only)=diagnostics option.

Which plot do you use to identify influential observations?

A.

Cook's D by Observation

B.

Residual by Quantile

C.

Residual by Predicted

D.

Fit - Mean and Residual Plot

SAS Institute A00-240 Summary

  • Vendor: SAS Institute
  • Product: A00-240
  • Update on: Jan 2, 2026
  • Questions: 99
Price: $52.5  $149.99
Buy Now A00-240 PDF + Testing Engine Pack

Payments We Accept

Your purchase with ExamsVCE is safe and fast. Your products will be available for immediate download after your payment has been received.
The ExamsVCE website is protected by 256-bit SSL from McAfee, the leader in online security.

examsvce payment method