Weekend Sale Limited Time 70% Discount Offer - Ends in 0d 00h 00m 00s - Coupon code: xmasmnth

The following scatter diagram displays the total life expectancy in years on the X axis...

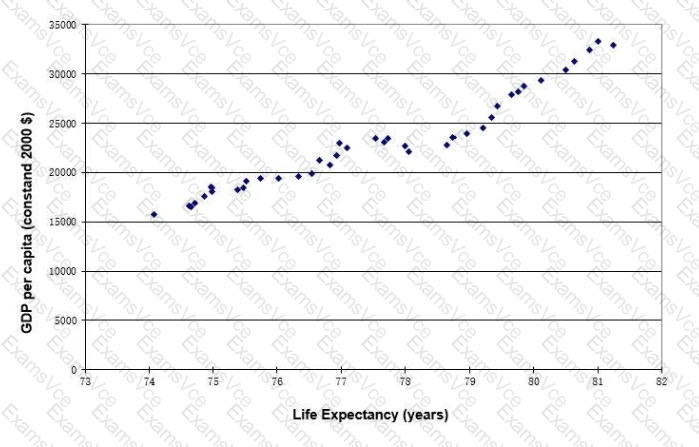
The following scatter diagram displays the total life expectancy in years on the X axis and GDP per capita (constant 2000 S) on the Y axis, in Country S for the past 40 years. Which of the following statements is true in respect of the graph?

A.

A perfect positive linear relationship is shown in the diagram.

B.

In most years, the samples shows a clear negative trend in the diagram

C.

There is no correlation between the level of GDP per capita and life expectancy.

D.

In some years, the level of GDP per capita and life expectancy moved in opposite directions.

CIMA BA1 Summary

  • Vendor: CIMA
  • Product: BA1
  • Update on: Jul 28, 2025
  • Questions: 468
Price: $52.5  $149.99
Buy Now BA1 PDF + Testing Engine Pack

Payments We Accept

Your purchase with ExamsVCE is safe and fast. Your products will be available for immediate download after your payment has been received.
The ExamsVCE website is protected by 256-bit SSL from McAfee, the leader in online security.

examsvce payment method