Understanding Control Charts and Variation TypesControl charts are used to monitor process stability over time by identifying different types of variation. Variations on a control chart can generally be categorized as:
Common Cause Variation: Random variation that is inherent to the process, typically within control limits.
Special Cause Variation: Variation that is unusual, not inherent to the process, and suggests an external factor or a change in the process.
Unique Cause Variation: This term is not commonly used in statistical process control; it likely refers to a special or unusual cause.
No Variation: Indicates a completely stable process with no changes over time, which is rarely the case in practice.
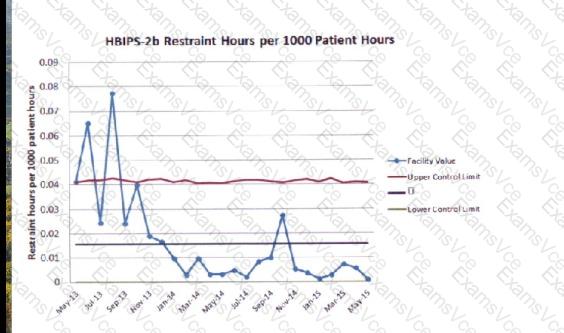
Interpreting the Control ChartThe control chart shows the rate of restraint hours per 1000 patient hours over time. Key indicators of special cause variation include:
Data points outside the control limits (Upper Control Limit and Lower Control Limit).
Patterns, such as runs of data points above or below the mean, or sudden shifts and spikes in data.
In this chart, we see several spikes (particularly in July and September of 2013 and again in October 2014) that reach or exceed the upper control limit. This suggests that certain events or changes in these periods caused the restraint hours to increase significantly, which is not due to the inherent process variation.
Conclusion for the Correct AnswerSince the chart displays data points that go outside the control limits and exhibit unusual patterns, it is indicative of Special Cause Variation. This suggests external factors or specific changes in the facility process during those periods that require further investigation to determine the cause of the spikes.
[References:, NAHQ Documentation on Control Charts and Process Variation, "Using Statistical Process Control to Monitor Quality Improvement in Healthcare" (NAHQ, 2019), , , , , ]