The correct answer is C. 18.40 . In CSSBB descriptive statistics, the mean is the total of all data values divided by the number of data points. For grouped frequency data, the estimated mean is found by using each class midpoint multiplied by its frequency, summing those products, and dividing by the total count.
The class intervals and midpoints are:
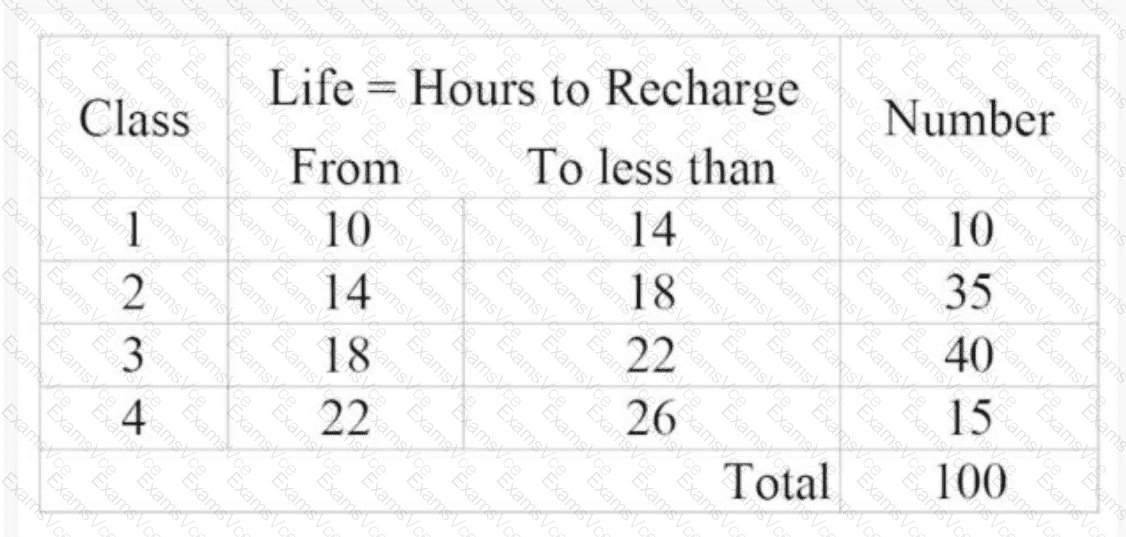
10 to less than 14 → midpoint 12 , frequency 10
14 to less than 18 → midpoint 16 , frequency 35
18 to less than 22 → midpoint 20 , frequency 40
22 to less than 26 → midpoint 24 , frequency 15
Now calculate:
(12 × 10) + (16 × 35) + (20 × 40) + (24 × 15)
= 120 + 560 + 800 + 360
= 1840
Total frequency = 100
Estimated mean = 1840 / 100 = 18.40
This is why option C is correct. Using class midpoints is the standard estimation method when only grouped frequency-distribution data are available rather than individual observations.