Tableau Desktop-Certified-Associate Question Answer
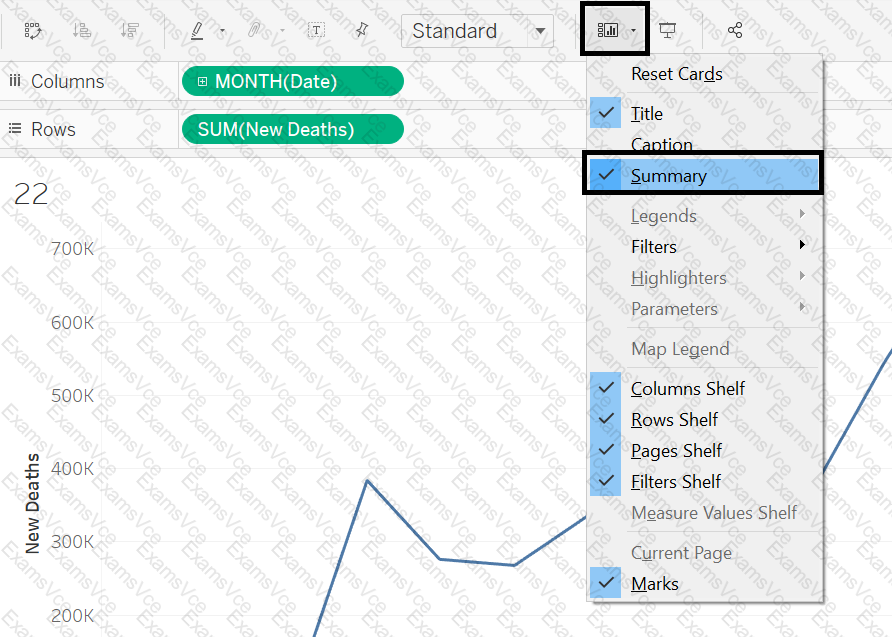
Connect to the "Covid data" source. Create a line chart using continuous months and new deaths. Find the Excess Kurtosis for the sum of new deaths.
 Chart, line chart
Description automatically generated
Chart, line chart
Description automatically generated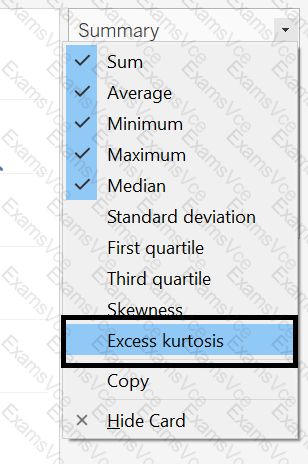 Graphical user interface, application
Description automatically generated
Graphical user interface, application
Description automatically generatedTableau Desktop-Certified-Associate Summary
- Vendor: Tableau
- Product: Desktop-Certified-Associate
- Update on: Jun 24, 2026
- Questions: 108


