Weekend Sale Limited Time 70% Discount Offer - Ends in 0d 00h 00m 00s - Coupon code: xmasmnth

An analysis of past sales data shows that the underlying trend in a company's sales...

An analysis of past sales data shows that the underlying trend in a company's sales volume can be represented by:

Y = 50X + 625

Where Y is the trend sales units for a quarter and X is the quarterly period number.

The seasonal variation index values have been identified as follows:

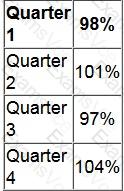
The forecast sales volume in units for quarter 4 next year, which is period 14, is:

A.

1,378

B.

1,325

C.

1,329

D.

1,274

CIMA P1 Summary

  • Vendor: CIMA
  • Product: P1
  • Update on: Jul 29, 2025
  • Questions: 260
Price: $52.5  $149.99
Buy Now P1 PDF + Testing Engine Pack

Payments We Accept

Your purchase with ExamsVCE is safe and fast. Your products will be available for immediate download after your payment has been received.
The ExamsVCE website is protected by 256-bit SSL from McAfee, the leader in online security.

examsvce payment method