Qlik QSDA2022 Question Answer
Refer to the exhibit.
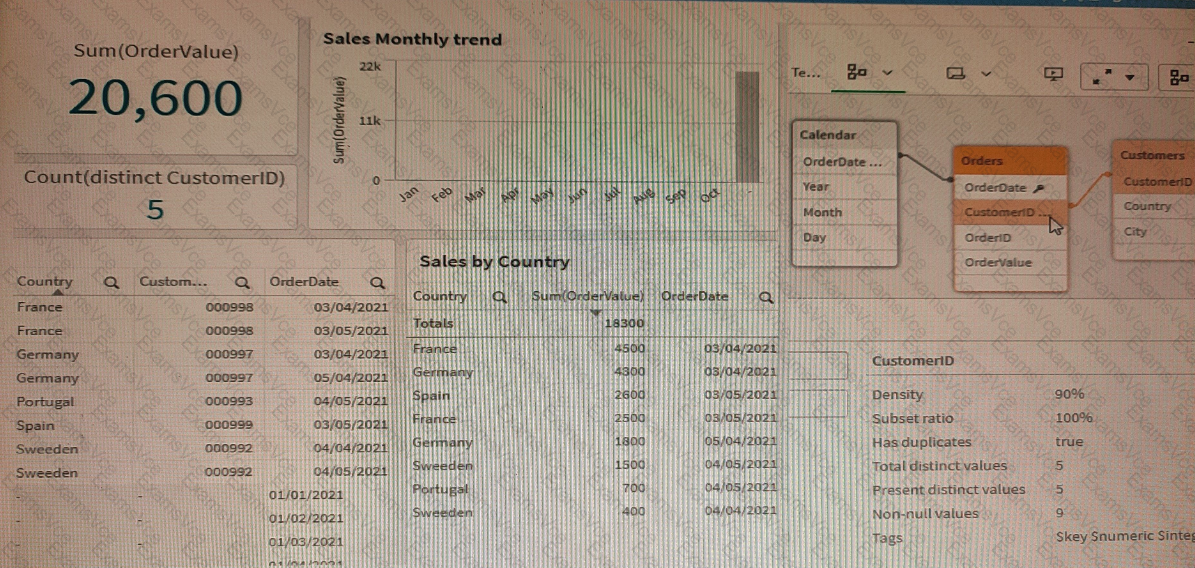
A data architect is working with an app and creates some visualizations to check the data. Some visualizations show issues in the data set.
* The Sales by Country table shows a total OrderValue of 18,300 sales while the KPI shows a total OrderValue of 20,600.
* The Sales monthly trend bar chart does not work with the Month field.
Which two data issues should the data architect fix in the app? (Select two.)
Qlik QSDA2022 Summary
- Vendor: Qlik
- Product: QSDA2022
- Update on: Jun 23, 2026
- Questions: 77


