Qlik QSDA2022 Question Answer
Refer to the exhibits.
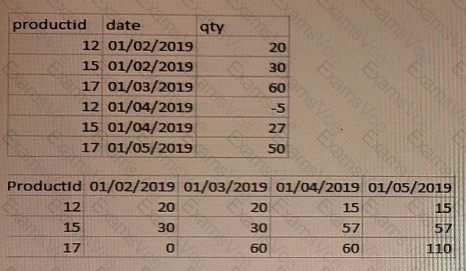
The first table shows the source table (Original table).
This data represents the stocks stored every month for each product:
• The relevant fields are productid, qty, and date.
• The date field represents the calendar months using
• The qty field shows the product stock fluctuation from the current month versus the previous month. If there is no fluctuation between months, there are no new entries in the table.
The second table shows a Pivot table visualization the data analyst needs to create in the app displaying per each product the monthly trend of available stock.
For performance reasons, the data analyst requests the data architect to calculate the running stock quantity of each product for every month in the script.
Which approach should the data architect use?
Qlik QSDA2022 Summary
- Vendor: Qlik
- Product: QSDA2022
- Update on: Jun 23, 2026
- Questions: 77


