Explanation
If you answered this question quickly and correctly, you're well prepared for the exam! Most students stumble while creating a Dual axis chart, so go ahead and give yourself a pat on the back!
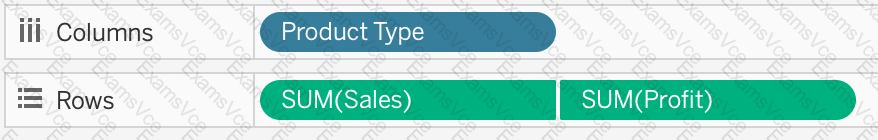
To create a dual axis chart for the problem mentioned:
1) Drag Product Type to the column shelf, and Sales and Profit to the Row shelf:
2) Now, to focus on 2013, drag Date to the filter shelf and select only 2013:
3) Now, click on the Profit pill in the Rows Shelf, and select dual axis:
4) Now, in the marks shelf, choose Sales, and change the chart type to bar. Similarly, for Profit, change the chart type to Line.
Now the chart looks like this:
Now we change the Profit chart type to line:
5) Finally, we synchronise the axis as follows: Right click on the axis, and choose 'Synchronise axis'
And, our final view and answer is:


