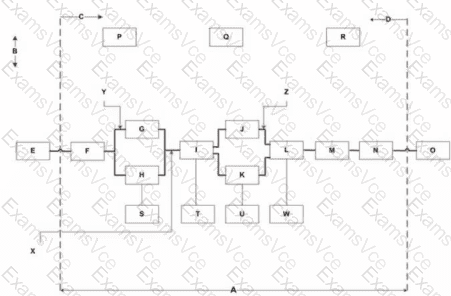
The diagram provided is a Function Analysis System Technique (FAST) diagram, a key tool in Value Methodology’s Function Analysis phase, as taught in the VMF 1 course (Core Competency #2). FAST diagrams map the relationships between functions of a system, with specific directions indicating the logic of the functions:
The horizontal axis represents the “how-why” logic (critical path), where moving left answers “why” and moving right answers “how.”
The vertical axis represents the “when” direction, indicating functions that occur simultaneously or continuously while the critical path functions are performed (e.g., all-the-time functions, as noted in Question 27).
According to SAVE International’s Value Methodology Standard, “in a FAST diagram, the ‘when’ direction is shown by vertical relationships, indicating functions that are concurrent or supporting the critical path.” In the diagram:
The critical path (horizontal, marked by Y in Question 3) runs from E to F to G to J to L to M to N to O.
Scope lines are labeled B (left) and D (right), as identified in Question 30.
Vertical arrows (e.g., Z in Question 3, pointing to J-K) indicate the “when” direction, showing functions that occur simultaneously with the critical path functions.
Ais a horizontal line at the bottom of the diagram, but in FAST diagramming, the vertical axis (and its bounding lines) is associated with the “when” direction. The options (A, B, C, D) include A as the bottom horizontal line, which, in some FAST diagram interpretations, can be seen as marking the boundary of the “when” direction (vertical relationships).
C(noted in Question 30) is an arrow pointing left, representing the “why” direction, not “when.”
Given the options,Ais the closest representation of the “when” direction, as it aligns with the vertical axis’s boundary, which defines the space where “when” relationships (simultaneous functions) are shown. In standard FAST diagramming, the “when” direction is vertical, and A, as the bottom horizontal line, frames the vertical space where these relationships are depicted (e.g., S, T, U, K).
Option A (A) is correct, as it represents the boundary of the vertical axis, which is associated with the “when” direction in FAST diagrams.
Option B (B) is incorrect because B is a scope line (left vertical), which defines the study’s boundary, not the “when” direction.
Option C (C) is incorrect because C is an arrow indicating the “why” direction (left), not “when.”
Option D (D) is incorrect because D is the right scope line, not related to the “when” direction.
[:, SAVE International, VMF 1 Core Competency #2 (Function Analysis), defining the “when” direction in FAST diagrams as vertical, indicating simultaneous functions., SAVE International, “Value Methodology Standard,” section on Function Analysis, describing FAST diagramming conventions, including the “when” direction as vertical relationships., ]