This scenario is a classic performance troubleshooting case covered under the Troubleshooting domain of the CompTIA Linux+ V8 objectives. The key indicators to analyze are the load average values and the CPU utilization statistics.
The uptime command shows load averages of 8.71, 8.24, and 7.71 over the 1-, 5-, and 15-minute intervals. Load average represents the average number of processes that are either running on the CPU or waiting to run. On a system with 4 CPU cores, a healthy load average would typically be close to or below 4. Load averages consistently near or above 8 indicate that there are significantly more runnable processes than available CPU resources, causing processes to wait and resulting in poor system responsiveness.
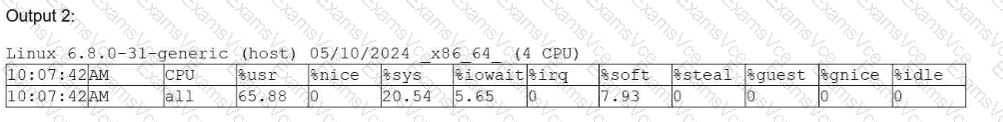
The CPU output further confirms this condition. The %idle value is 0, meaning the CPU has no idle time available. The majority of CPU time is spent in user space (65.88%) and system/kernel space (20.54%), indicating heavy computational and kernel activity. While %iowait is present at 5.65%, it is not high enough to suggest that disk I/O is the primary bottleneck.
Option C, high CPU load, best explains the symptoms. High CPU load causes commands to execute slowly because processes are competing for limited CPU time. This directly matches the observed behavior of the system being unresponsive.
The other options are incorrect. High uptime simply indicates how long the system has been running and does not cause performance issues by itself. High latency is a general term and not a specific diagnosis shown by the metrics provided. High I/O wait times would require a significantly higher %iowait value.
According to Linux+ V8 documentation, correlating load averages with CPU core count and utilization is essential for accurate performance diagnosis. Therefore, the correct answer is C. High CPU load.