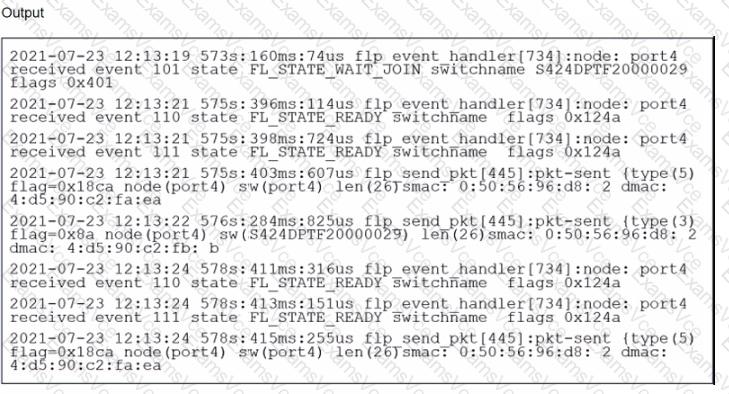
The provided debug output indicates that the FortiSwitch is sending FortiLink heartbeats to the FortiGate and is currently waiting to join the stack group. Here ' s a breakdown of the relevant lines:
Line 1:Shows the date, time, elapsed time since boot, and process ID for the FortiLink event handler.
573s:160ms: 74ustranslates to roughly 573 seconds, 160 milliseconds, and 74 microseconds since uptime.
Event 101:This indicates the FortiSwitch is in a " wait join " state (FL_STATE_WAIT_JOIN). This means it ' s discovered by the FortiGate and is awaiting further instructions to join the FortiLink stack group.
switchname S424DPTF20000029:This displays the serial number of the FortiSwitch.
flags 0x401:The specific flag meaning might depend on the FortiSwitch model and version, but it likely indicates general communication between the switch and FortiGate.
Lines 2 and onward:These lines show subsequent events with similar timestamps, suggesting a regular heartbeat interval. There are also instances of the FortiSwitch sending packets to the FortiGate (indicated bypkt-sent).
Why the Other Options Are Less Likely:
C. FortiSwitch is discovered and authorized by FortiGate.While discovery might have happened before these lines, the " wait join " state suggests authorization hasn ' t necessarily completed yet.
D. FortiSwitch is ready to push its new hostname to FortiGate.There ' s no explicit indication of hostname changes in this excerpt.The focus is on joining the stack group.
In Summary:
The key point is the " FL_STATE_WAIT_JOIN " state, which signifies the FortiSwitch is ready to be fully integrated but is waiting for further commands from the FortiGate to complete the process.