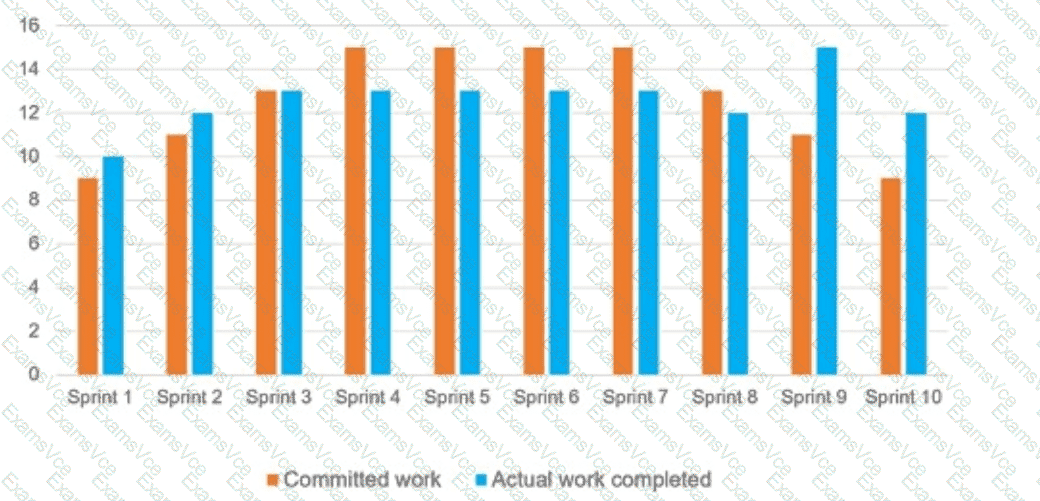
To determine the best description of the team ' s performance, we analyze the chart showing:
Committed work (orange bars): what the team planned to do.
Actual work completed (blue bars): what the team actually accomplished.
Key Observations:
In most sprints (e.g., 1, 3, 4, 5, 6, 8, 10), the actual work is slightly less than the committed work.
In Sprints 9 and 10, the actual work exceeds the committed work.
There ' s inconsistency in how much work is completed compared to what ' s committed.
Interpretation:
The team frequently overestimates its capacity. This suggests a misalignment between planning and execution, which indicates that their velocity is not yet well-understood or accurately reflected in sprint planning.
According to the CompTIA Project+ PK0-005 Exam Objectives:
Under Domain 1.2: Compare and contrast Agile vs. Waterfall concepts, understanding team velocity, iteration planning, and the ability to plan based on past performance is key to Agile success.
" Agile teams should use velocity as a guide to improve predictability. Sprint commitments should align with the team’s proven delivery capacity. "